Dan Yan,
Wei Peng,
Yujie Liu,
Dashuai Xie,
Meibian Hu,
Xingbao Tao,
Chunjie Wu ![]()
For correspondence:- Chunjie Wu Email: wucjcdtcm@163.com Tel:+8602861801001
Received: 9 January 2016 Accepted: 20 April 2016 Published: 27 May 2016
Citation: Yan D, Peng W, Liu Y, Xie D, Hu M, Tao X, et al. Spectrum-effect relationships between high performance liquid chromatography fingerprints and bioactivities of charred areca nut. Trop J Pharm Res 2016; 15(5):1017-1024 doi: 10.4314/tjpr.v15i5.17
© 2016 The authors.
This is an Open Access article that uses a funding model which does not charge readers or their institutions for access and distributed under the terms of the Creative Commons Attribution License (http://creativecommons.org/licenses/by/4.0) and the Budapest Open Access Initiative (http://www.budapestopenaccessinitiative.org/read), which permit unrestricted use, distribution, and reproduction in any medium, provided the original work is properly credited..
Purpose: To investigate the spectrum-effect relationships between high performance liquid chromatography (HPLC) fingerprints and duodenum contractility of charred areca nut (CAN) on rats.
Methods: An HPLC method was used to establish the fingerprint of charred areca nut (CAN). The promoting effect on contractility of intestinal smooth was carried out to evaluate the duodenum contractility of CAN in vitro. In addition, the spectrum-effect relationships between HPLC fingerprints and bioactivities of CAN were investigated using multiple linear regression analysis (backward method).
Results: Fourteen common peaks were detected and peak 3 (5-Hydroxymethyl-2-furfural, 5-HMF) was selected as the reference peak to calculate the relative retention time of 13 other common peaks. In addition, the equation of spectrum-effect relationships {Y = 3.818 - 1.126X1 + 0.817X2 - 0.045X4 - 0.504X5 + 0.728X6 - 0.056X8 + 1.122X9 - 0.247X13 - 0.978X14 (p < 0.05, R2 = 1)} was established in the present study by the multiple linear regression analysis (backward method). According to the equation, the absolute value of the coefficient before X1, X2, X4, X5, X6, X8, X9, X13, X14 was the coefficient between the component and the parameter.
Conclusion: The model presented in this study successfully unraveled the spectrum-effect relationship of CAN, which provides a promising strategy for screening effective constituents of areca nut.
Introduction
The seed of Areca catechu (belonging to the family of Arecaceae), also called areca nut (AN), is a famous and widely used traditional Chinese medicine (TCM) in China [1]. Areca nut is commonly used to treat parasitic diseases, dyspepsia and abdominal distension, etc [1,2]. Furthermore, for clinical treatment of dyspepsia and abdominal distension, areca nut is commonly processed by stir-baking to dark brown, resulting in charred areca nut (CAN) [3]. The aim of this process is mainly related to enhancing the effects of areca nut on gastrointestinal contraction [4]. In addition, previous investigation reported that arecoline is the major active constituent of areca nut, however, the quantity of arecoline is sharply decreased by this processing. Thus, the substance basis of the charred areca nut is still unclear [5,6].
It’s well known that TCMs possess various active constituents and play lots of pharmacological activities via actions of multi-channels, multi-constituents, and multi-targets [7,8]. Additionally, the spectrum-effect relationships assay based on HPLC fingerprints and bioactivities is a good strategy for investigating the active compositions of TCMs [9,10]. Therefore, the present study was designed to investigate the spectrum-effect relationships between high performance liquid chromatography (HPLC) fingerprints and activity of charred areca nut on gastrointestinal contraction. This research would be beneficial for the quality control of charred areca nut and provide a promising strategy for screening effective constituents from this plant.
Methods
Chemicals and reagents
Formic acid, acetonitrile, and methanol of HPLC grade were acquired from Sigma-Aldrich (Shanghai, China); the water used was purified by a Millipore water purification system (Millipore, Bedford, MA, USA); the reference standard agents including 2,3-dihydro-3,5-dihydroxy-6-methyl-4H-pyranone (DDMP), 5-Hydroxymethyl-2- furfural (5-HMF) and 3-hydroxy-2-methyl-γ-pyrone (maltol) were purchased from the China Institute of pharmaceutical and biological products (Beijing, China). All other chemicals and reagents used in the experiment were of analytical grade.
Samples
The dried seeds of Areca catechu L. were obtained from Hehuachi Market of Traditional Chinese Herbs (Chengdu, China) in 2015, and identified by Professor Chun-Jie Wu [College of pharmacy, Chengdu University of Traditional Chinese Medicine, Chengdu, 610075, P.R. China. They were processed by stir-baking to dark brown as previous report with an online-type and non-contact temperature measurement system (ONTMS, Haishan Pharmaceutical Equipment Co. Ltd., Hangzhou, China) [11,12]. A voucher specimen (sAN-20150903) has been deposited in College of Pharmacy, Chengdu University of Traditional Chinese Medicine (Chengdu, China).
Animals
Sprague Dawley (SD) rats (weighing from 180 to 220 g) [Certificate No. SCXK (Chuan) 2008-24] were provided by Dashuo experimental animal Co. Ltd. (Chengdu, China). Total 16 SD rats were used in our present duodenum contractility assay; eight were used for establishing the spectrum-effect relationships and the other eight rats were used for verification of the obtained spectrum-effect relationship equation. The animals were kept under controlled conditions of free access to chow and tap water, a 12 h light-dark cycle in a quarantine room and temperature range from 20 to 25 °C. They were fed for one week acclimatization period before experiments. All the experiments involving animals carried out were in accordance with the animal-use guidelines and approved by the Animal Ethics Committee of Chengdu University of Traditional Chinese Medicine (approval no. TCM20150903-AN-03).
HPLC fingerprints assay
CAN was powdered and sieved through a 50 mesh sieve (inner diameter 355 ± 13 μm). An amount of 0.3 g was accurately weighed and added into 50 mL grinding mouth Erlenmeyer flask, and extracted with 30 mL 40 % methanol (formic acid adjusted pH = 3.0) by ultrasonic extraction for 40 min. After filtering, the solution was prepared and then filtered through 0.45 μm millipore film for HPLC analysis.
Preparation of reference standard solution
The mixed standard solutions containing 0.5 mg/mL DDMP, 5-HMF, and Maltol were prepared by adding an accurately weighed amount of each standard stock into a volumetric flask and dissolving with 10 mL 40 % methanol and then filtered through 0.45 μm millipore film to yield the mixed standard solution.
Assay method
Method precision and reproducibility were evaluated by the successive analysis of six replicate injections of one sample and the injections of 6 samples prepared independently from S1 which had the best peak forms and peak resolution among the samples, respectively; meanwhile, to investigate sample stability, the sample was determined in different time points in a day (0, 2, 4, 8, 16 and 24 h).
HPLC assay conditions
The HPLC chromatographic separation was performed using a gradient elution with a CAPCELL PAK MG II S5 C18 column (250 mm × 4.6 mm, 5 μm) (Shiseido, Japan) at 30 °C. The mobile phase was composed of solvent A (acetonitrile) and solvent B (water solution, the pH was adjusted to 3.0 with formic acid) working with a linear gradient as follows: 0 – 10 min (95 %, B), 10 – 30 min (95 – 85 %, B), 30 – 60 min (85 – 70 %, B) with a mobile flow rate of 1.0 mL/min. The detection wavelength was set at 283 nm with the sample injection volume of 10.0 μL.
Tissue preparation and determination of the duodenum contractility
Samples preparation for contractility research were the same as that for HPLC analysis, except for the second step that the sample was extracted with sterilized Millipore water instead of 40 % methanol. According to the previous report, the final concentration of samples solution was dissolved at 40 μg/mL [6]. The determination of duodenum contractility was carried out according to previously report [12]. Rats were fasted for 12 h before being sacrificed by cervical dislocation. Then the duodenum was excised from rats and stripped into approximately 2.0 cm segment. The contractility of intestinal smooth muscle was determined by using a 4 channel automatic organ bath system (Panlab S.L., Spain). One end of the smooth muscle segment was connected to a force-displacement transducer in longitudinal direction, and the other end was fastened to the bottom side of the organ bath chamber (20.0 mL solution). The initial load of resting tension was set at 2.0 g and before a dynamically equilibrated contractile state of duodenum segment was obtained, the buffer was changed every 10 min. Contractile response was recorded by using a physiological recording system of Panlab (Lab Chart 7 Chinese, Spain) with 8 independent assays.
Statistical analysis
The spectrum-effect relationship between HPLC fingerprints and promoting contractility of charred areca nut was analyzed by the multiple linear regression analysis using SPSS 17.0 software (SPSS Inc., Chicago, IL, USA). Data are expressed as mean ± standard deviation (SD) or percentage. One-way analysis of variance (ANOVA) followed by Student's t-test was used to analyze the differences between the groups. P < 0.05 was considered statistically significant.
Results
HPLC fingerprints data
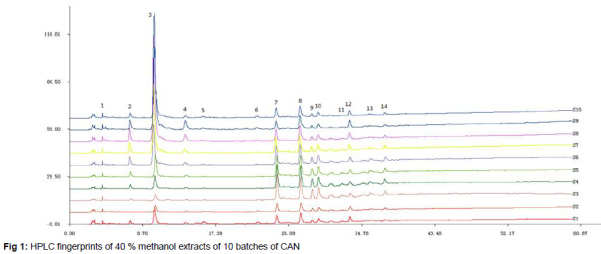
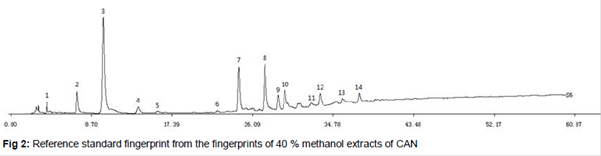
In our present study, results of methodology validation showed that the relative standard deviation (RSD) for reproducibility and precision were 0.1 - 0.3 % and 0.04 - 0.25 %, respectively. In addition, the R.S.D. value of the storage stability was below 0.55 %. All results above indicated that the method of HPLC fingerprint analysis was valid and satisfactory. HPLC fingerprints of 40 % methanol extracts of CAN were obtained under the optimized processing condition and shown in , and the reference standard fingerprint was generated in . Peaks, which existed in all chromatograms of the 10 chromatograms of CAN samples from different charred degrees, with well segregation and large areas from subsequent peaks, were regarded as “common peaks”, indicating similarity among diverse samples.
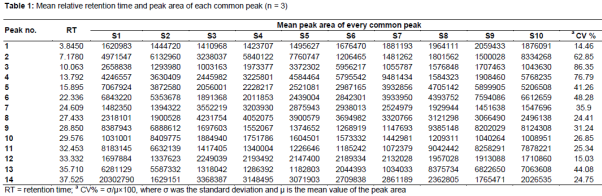
From the samples, fourteen common peaks were found by comparison of their HPLC retention time and ultraviolet spectra, and these 14 common peaks were marked in Figures 1 and 2. Peak 3, which was 5-HMF at the mean retention time 10.063 min by the comparison between the chromatogram of sample and the reference standard solution, was selected as the reference peak to calculate the relative retention time of other 13 common peaks. The average relative retention time, the coefficient of variance (CV %) and average peak area (n = 3) of the peak area of 14 common characteristic peaks were shown in . The values of C.V. % of the peak area of common characteristic peak were all greater than 14.46 %, indicating that the content of each constituent in different samples diverse significantly, especially peaks 3 (5-HMF), 2 (DDMP), and 4 (Maltol).
Results of the duodenal contractility determination
In the present study, the promoting effects of 10 batches of CAN on duodenum contractility of rats were evaluated, and the duodenum contractilities of different CAN samples (40 μg/mL) are showed in . The duodenum contractilities of 10 batches of CAN (S1-S10) used to establish the spectrum-effect relationship were 3.27, 3.18, 3.21, 3.38, 3.41, 3.51, 3.73, 3.94, 4.12 and 3.54 g, respectively.
Spectrum-effect relationship
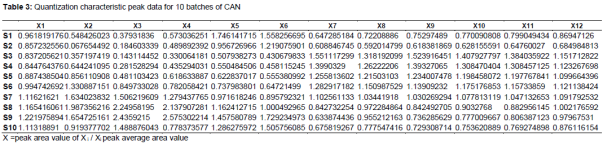
Each peak areas of the 10 batches of CAN were digitized by using the following equation (1), and processing into quantized characteristic peak data which is showed in .
X = P/P0 ………………..……………..…. (1)
where P is the area value of Xi peak, P0 is the average area value of Xi peak (i = 1~14).
Quantization characteristic peak data was independent variables, intestinal contractile activity was the dependent variable, and the equation regarding spectrum – effect of CAN was established by using the multiple linear regression analysis (backward method).
Y = 3.818 - 1.126X1 + 0.817X2 - 0.045X4 - 0.504X5 + 0.728X6 - 0.056X8 + 1.122X9 - 0.247X13 - 0.978X14 (p < 0.05, R2 = 1)…………….. (2)
The absolute value of the coefficient before X1, X2, X4, X5, X6, X8, X9, X13, X14 was the coefficient between the component and the parameter. The bigger the coefficient of the parameter, the better correlation the component had with the parameter. The above equations showed that the values of Y were mainly decided by X1, X9 and X14, showing that X1, X9 and X14 had the main influence on promoting effects of CAN on contraction activity.
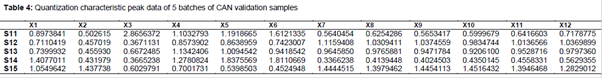
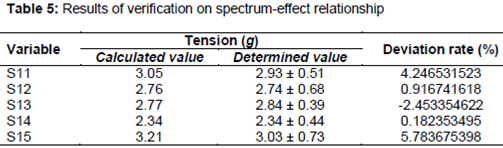
In addition, in our present investigation, another five batches of CAN were used to verify the equation we obtained. The quantized HPLC characteristic peak data of the 5 batches of CAN were showed in . Furthermore, the contraction activities of the 5 batches of CAN were calculated by using the established spectrum – effect equation (2) which shown in . Subsequently, the deviation rate between the real determined and calculated values of contraction activities were calculated using Eq 3.
Deviation rate = {(E/T) – 1}100 …………..... (3)
where E and T are estimated and true values, respectively.
As can be seen from the , all the deviation rate of 5 batches of CAN were less than 6 %, indicating that the equation (2) we established is successful.
Discussion
Nowadays, single or few components are commonly used as evaluating indicators to control TCMs’ quality [13]. However, overall effect and synergistic effects of multi-components are characteristics of TCMs [14]. Therefore, the currently used quality controlling method cannot reflect the real bioactivities of TCM. In addition, increasing researches have demonstrated that spectrum-effect relationships assay possesses unique advantages for investigating the possible and potential active substances of TCMs [10,15].
In our present study, we investigated the spectrum-effect relationship between HPLC fingerprints and bioactivities of charred areca nut (CAN) for the first time, and obtained a possible formula to evaluate the duodenum contractility of CAN.
HPLC is the most commonly used method for investigating TCMs’ fingerprint based on its inexpensive, rapid, and high sensitive characteristics [16]. Thus, in our study, we investigated the fingerprint spectrum of CAN using the HPLC assay, and we identified the chromatographic peaks of DDMP, 5-HMF, and maltol.
Based on traditional Chinese medicinal theory, areca nut is a known herbal medicine with the functions of killing parasites and promoting digestion. After processing by stir-baking to dark brown, charred areca nut’s promoting effect on digestion are enhanced [1,2]. In addition, the related mechanism of promoting digestion is commonly based on promoting effects of CAN on contractility of digestive tract smooth muscle [17].
Thus, in the present study, we selected the duodenum contractility to represent the promoting effects of CAN on digestion. The results showed that the model presented in this study successfully discovered the spectrum-effect relationship of CAN. Based on the results of HPLC fingerprint spectrum and duodenum contractility, the following relationship was obtained:
Y = 3.818 - 1.126X1 + 0.817X2 - 0.045X4 - 0.504X5 + 0.728X6 - 0.056X8 + 1.122X9 - 0.247X13 - 0.978X14 (p < 0.05, R2 = 1),
which can be used to evaluate the duodenum contractility of CAN samples. Besides, the verification test results also demonstrated the reliability of this formula.
Conclusion
To the best of our knowledge, the present investigation is the first study on the spectrum-effect relationship between HPLC fingerprints and bioactivity of charred areca nut. The findings provide a rapid and valid method to evaluate the relationship between effective constituents and the biological activities of CAN.
Declarations
Acknowledgement
References
Archives


News Updates